Sample - Population Map
This page provides a complete example of a Live Data map that shows population data for the 50 United States.

The tour above can be run standalone here: https://mapsalive.com/samples/83754.
Request
When the map above first loads, the code shown below executes a server request to get data for all 50 states. The response from the server is handled by the code shown in the Response Handler section that follows.
function onEventPageLoading(event) {
   let url = `https://livedata.mapsalive.com/python/population/service.py`;
   event.api.liveData.requestData("json", "", url);
}
Response Handler
Live Data calls the code below 50 times, once for each state in the response from the server. It assigns the information about each state to the state's hotspot. A sample of the response data is shown in the next section.
function onEventLiveDataResponse(event) {
   let response = event.response;
   if (response.error) {
      alert(`Error: ${response.data}`);
      return;
   }
   let json = response.data;
   event.api.setHotspotTitle(response.id, `${json.capital}, ${json.name}`);
   event.api.setHotspotHtml(response.id, json.html);
}
Response
The JSON objects returned for the first three of 50 states appear below.
[
    {
        "id": "AL",
        "name": "Alabama",
        "capital": "Montgomery",
        "html": "<div class='state'><div><img src='https://livedata.mapsalive.com/images/flags/AL.jpg'></div>
        <div class='state-census'>State population from 2020 Census</div><div class='state-population'>5,024,279</div>
        <div class='state-city'>Largest City: <strong>Huntsville</strong></div></div>"
    },
{
        "id": "AK",
        "name": "Alaska",
        "capital": "Juneau",
        "html": "<div class='state'><div><img src='https://livedata.mapsalive.com/images/flags/AK.jpg'></div>
        <div class='state-census'>State population from 2020 Census</div><div class='state-population'>733,391</div>
        <div class='state-city'>Largest City: <strong>Anchorage</strong></div></div>"
},
{
        "id": "AZ",
        "name": "Arizona",
        "capital": "Phoenix",
        "html": "<div class='state'><div><img src='https://livedata.mapsalive.com/images/flags/AZ.jpg'></div>
        <div class='state-census'>State population from 2020 Census</div><div class='state-population'>7,151,502</div>
        <div class='state-city'>Largest City: <strong>Phoenix</strong></div></div>"
},
...
Script - Python
The Python script below is used by the tour above. It handles the request for population data by reading the CSV file shown at the end of this page and returning a response as JSON. The JSON contains an html property that contains <div> tags with class names so that they can be styled using the CSS that is shown below the script.
This script is located at https://livedata.mapsalive.com/python/population/service.py.
#!/usr/bin/python3

import csv
import json

def handle_request():
    states = read_states()
    responses = []

    for state in states:
        html = f"<div class='state'>"\
               f"<div class='flag'><img src='{state['Flag']}'></div>"\
               f"<div class='state-census'>State population from 2020 Census</div>"\
               f"<div class='state-population'>{int(state['Population']):,}</div>"\
               f"<div class='state-city'>Largest City: <strong>{state['Largest City']}</strong></div>" \
               f"</div>"

        response = {
            "id": f"{state['State']}",
            "name": f"{state['Name']}",
            "capital": f"{state['Capital']}",
            "html": html
        }

        responses.append(response)

    print("Content-Type: application/json\n")
    print(json.dumps(responses))


def read_states():
    states = []

    with open('states.csv', encoding='utf-8-sig') as csv_file:
        csv_reader = csv.DictReader(csv_file)
        for index, state in enumerate(csv_reader):
            states.append(state)
    return states

handle_request()
CSS for Python Script
The CSS shown below styles the HTML from the Python script above. This CSS could be placed in the CSS field on the tour's Custom HTML screen or in a separate .css file.
#maPopupPanel {
   background-color:rgba(255,255,255,0.75);
}

#maPopupTitle, #maPopupText {
   background-color:rgba(255,255,255, 0.0);
}

#maPopupTitle {
   font-size:20px;
   text-align: center;
}

.flag {
  display: flex;
  align-items: center;
  height: 80px;
  padding: 8px;
}

.flag img {
   box-shadow: 0 2px 8px rgb(128 128 128);
   max-height: 100%;
   vertical-align: middle;
}
.state {
   display: flex;
   flex-direction: column;
   align-items: center;
   row-gap: 6px;
}

.state-population{
   font-size: 32px;
   font-weight: bold;
   line-height: 32px;
   margin: 2px 0;
}

.state-census {
   font-size: 14px;
}
Script - PHP
The PHP script below is not used by the tour above but is provided to show how the logic in the Python script could be implemented in PHP. Both scripts read from a CSV file, but the PHP script's response contains only data properties with no HTML. You can see the difference in responses between this script and the Python version by clicking the links for this script and the Python script. To better understand the different choices for what kind of response a script returns, see the section on using CSS and JavaScript with Live Data.
This script is located at https://livedata.mapsalive.com/php/population/service.php.
<?php
function handleRequest()
{
    $states = readStates();
    $responses = [];

    foreach ($states as $state)
    {
        $response = new class{};
        $response->id = $state[0];
        $response->name = $state[1];
        $response->population = $state[2];
        $response->capital = $state[3];
        $response->city = $state[4];
        $response->flag = $state[5];
        $responses[] = $response;
    }

    header("Content-Type:application/json");
    header('Access-Control-Allow-Origin: *');

    echo json_encode($responses);
}

function readStates()
{
    $array = [];
    if (($handle = fopen("states.csv", "r")) === false)
        return $array;

    $row = 0;
    while (($data = fgetcsv($handle)) !== false)
    {
        if ($row >= 1)
            $array[] = $data;
        $row += 1;
    }

    fclose($handle);
    return $array;
}

handleRequest();
?>
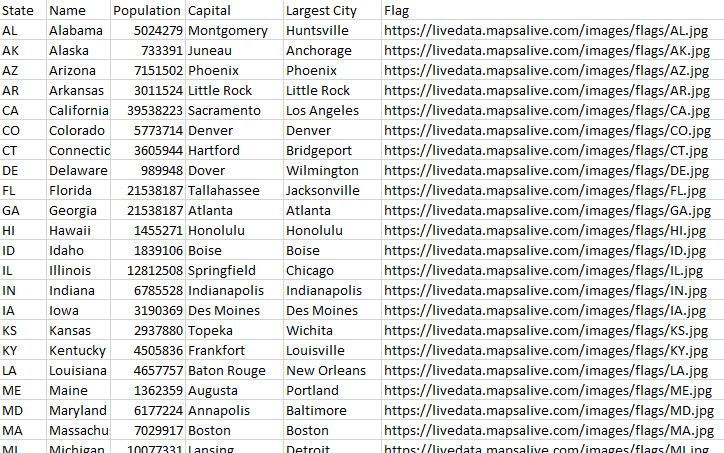
CSV Data
The script above reads data from a CSV file. The first several rows of the file are shown below.